Scan Data Table
The scan data table is the main place to review scans in Data > Scans. It shows the scans in the selected data set, grouped by scan type.
Table Controls
Section titled “Table Controls”Use the toolbar above the table to manage the current view:
| Control | What It Does |
|---|---|
| Delete | Deletes selected scans when you have write access. |
| History | Opens scan modification history when exactly one scan is selected. This control appears when scan history is available for your account. |
| Sort | Restores the standard scan sorting order. |
| Filters | Removes active table filters. |
| Table | Exports the current table view. This is separate from Data > Export. |
| Group Settings | Controls whether scan type groups start collapsed, whether the first group opens automatically, and whether only one group stays open at a time. |
The table starts grouped by scan type. Within those groups, the default sort uses scan type, particle, energy, mode, field size, depth, and wedge.
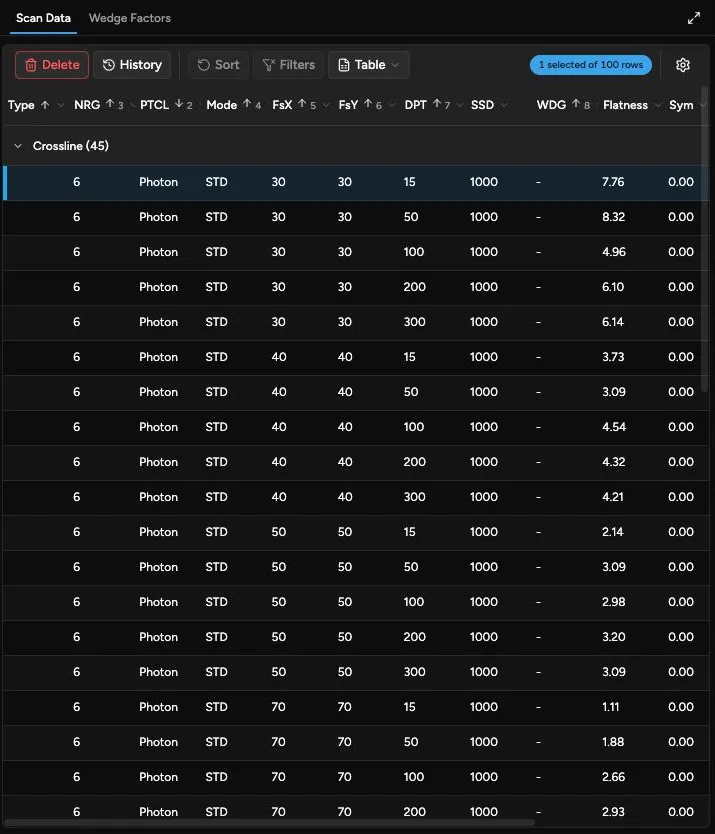
Table Export
Section titled “Table Export”The Table export is for the scan table itself. It is not the same as exporting a data set for another system.
The table export menu includes:
- Copy to Clipboard: copies the visible table columns as tab-separated text.
- Download CSV: downloads the visible table columns as
scan-data.csv.
The export follows the current table filtering and sorting. Collapsed groups do not hide rows from the export; filtered-out rows are excluded.
Use table export when you want a quick spreadsheet-style copy of the scan list. Use Data > Export when you need a clinical or vendor-specific scan data file.
Columns
Section titled “Columns”| Column | Meaning |
|---|---|
| NRG | Beam energy. Filters show photon values in MV and electron values in MeV when the particle is known. |
| PTCL | Particle, such as photon or electron. |
| Mode | Beam mode, such as standard, FFF, SRS, or another configured mode. |
| FsX | X jaw or field dimension for the scan, in millimeters. |
| FsY | Y jaw or field dimension for the scan, in millimeters. |
| DPT | Measurement depth, in millimeters. Filters may group shallow depths as DMax. |
| SSD | Source-to-surface distance. |
| Type | Scan type abbreviation. See the scan type table below. |
| WDG | Wedge, when present. |
| Flatness | Profile flatness for inline and crossline scans. Quadrant uses the calculation method associated with the linear accelerator make when known, such as Varian or Elekta. |
| Sym | Profile symmetry for inline and crossline scans. Quadrant uses the calculation method associated with the linear accelerator make when known, such as Varian or Elekta. |
| PDD10 | Photon percent depth dose at 10 cm, when available. |
| R50 | Electron depth where dose falls to 50% of maximum dose, when available. |
| DRef | Electron reference depth derived from R50, when available. |
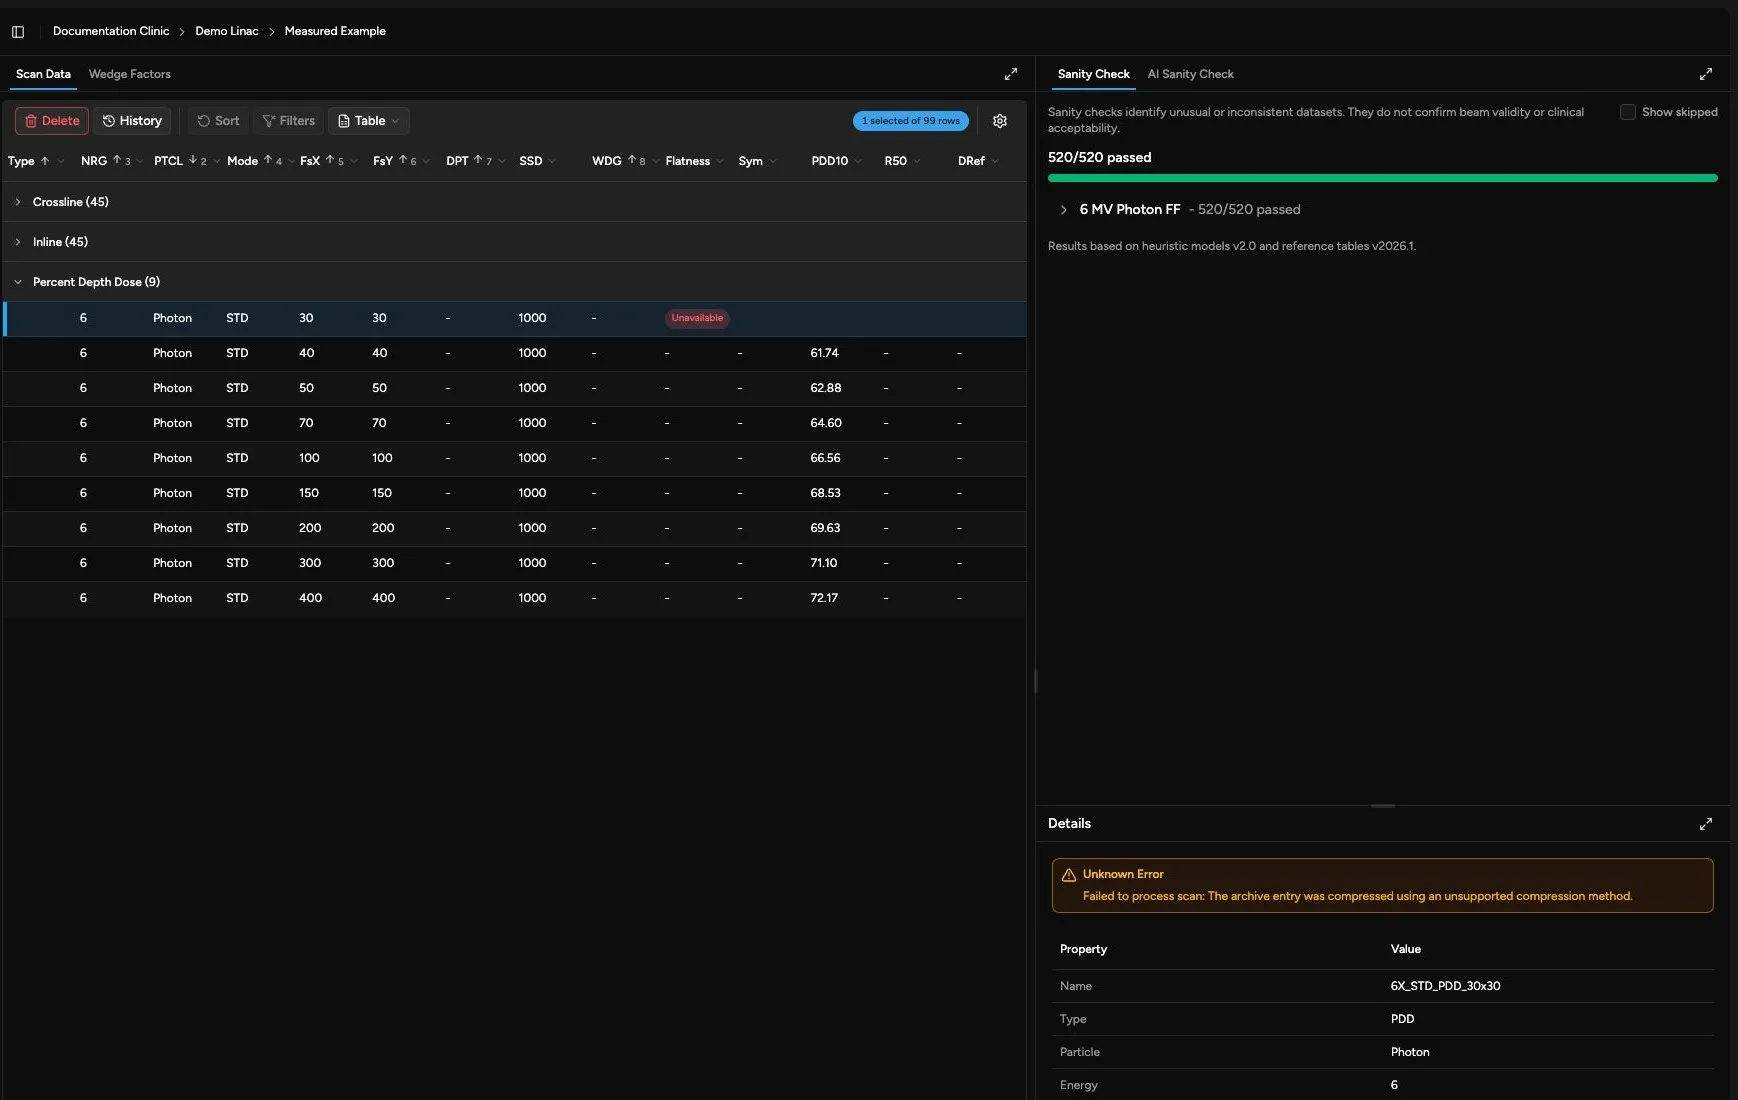
Unavailable scans may show an Unavailable marker instead of calculated values. Select the scan and review the details panel for the reason.
Flatness and symmetry values are shown only for supported profile scans. If the linear accelerator make is not known, Quadrant falls back to its default profile calculation method.
Scan Types
Section titled “Scan Types”| Type | Meaning |
|---|---|
| PDD | Percent depth dose. |
| CRO | Crossline profile. |
| INP | Inline profile. |
| DIA | Diagonal profile. |
| TMR | Tissue maximum ratio. |
| SCT | Output factors at calibration depth, typically 100 mm for photons and dmax for electrons. The table group may label this as Scatter. |
| SCP | Total scatter at dmax. |
| SC | Collimator scatter at dmax. |
| SP | Phantom scatter at dmax. |
| VOL | Volume scan data. |
| SVOL | Sparse volume scan data. |
If an imported file contains another scan type abbreviation, Quadrant shows that abbreviation in the table.
Selecting Scans
Section titled “Selecting Scans”Select a row to update the visualization and details panels. Select multiple rows when you want to compare compatible scans in a chart.
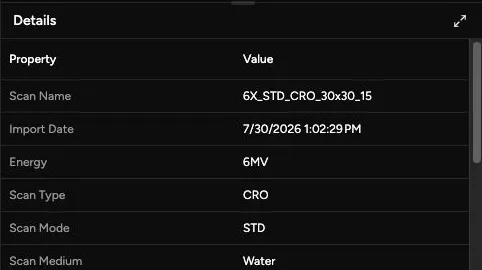
The details panel shows detailed properties for one scan. If several scans are selected, choose a single scan when you need the detailed property list.
Visualization Tabs
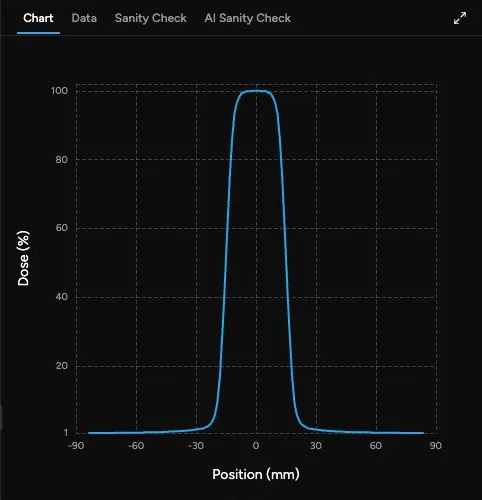
Section titled “Visualization Tabs”Quadrant chooses visualization tabs from the selected scan’s data shape:
| Selected Data | Available Tabs |
|---|---|
| Curve-like scans, such as PDDs, inline profiles, crossline profiles, diagonal profiles, TMRs, and compatible scatter curves | Chart. For a single selected scan, Data is also available for point values. |
| Large photon SCT data arranged as a field-size surface | Surface. For a single selected scan, Table is also available. |
| Point-style scatter data | Table for a single selected scan. |
| Any selected data set | Sanity Check. |
When multiple scans are selected, Quadrant only shows tabs that support the current selection. For example, curve scans can be overlaid in Chart, while single-scan point tables are only available when one scan is selected.
Scan History
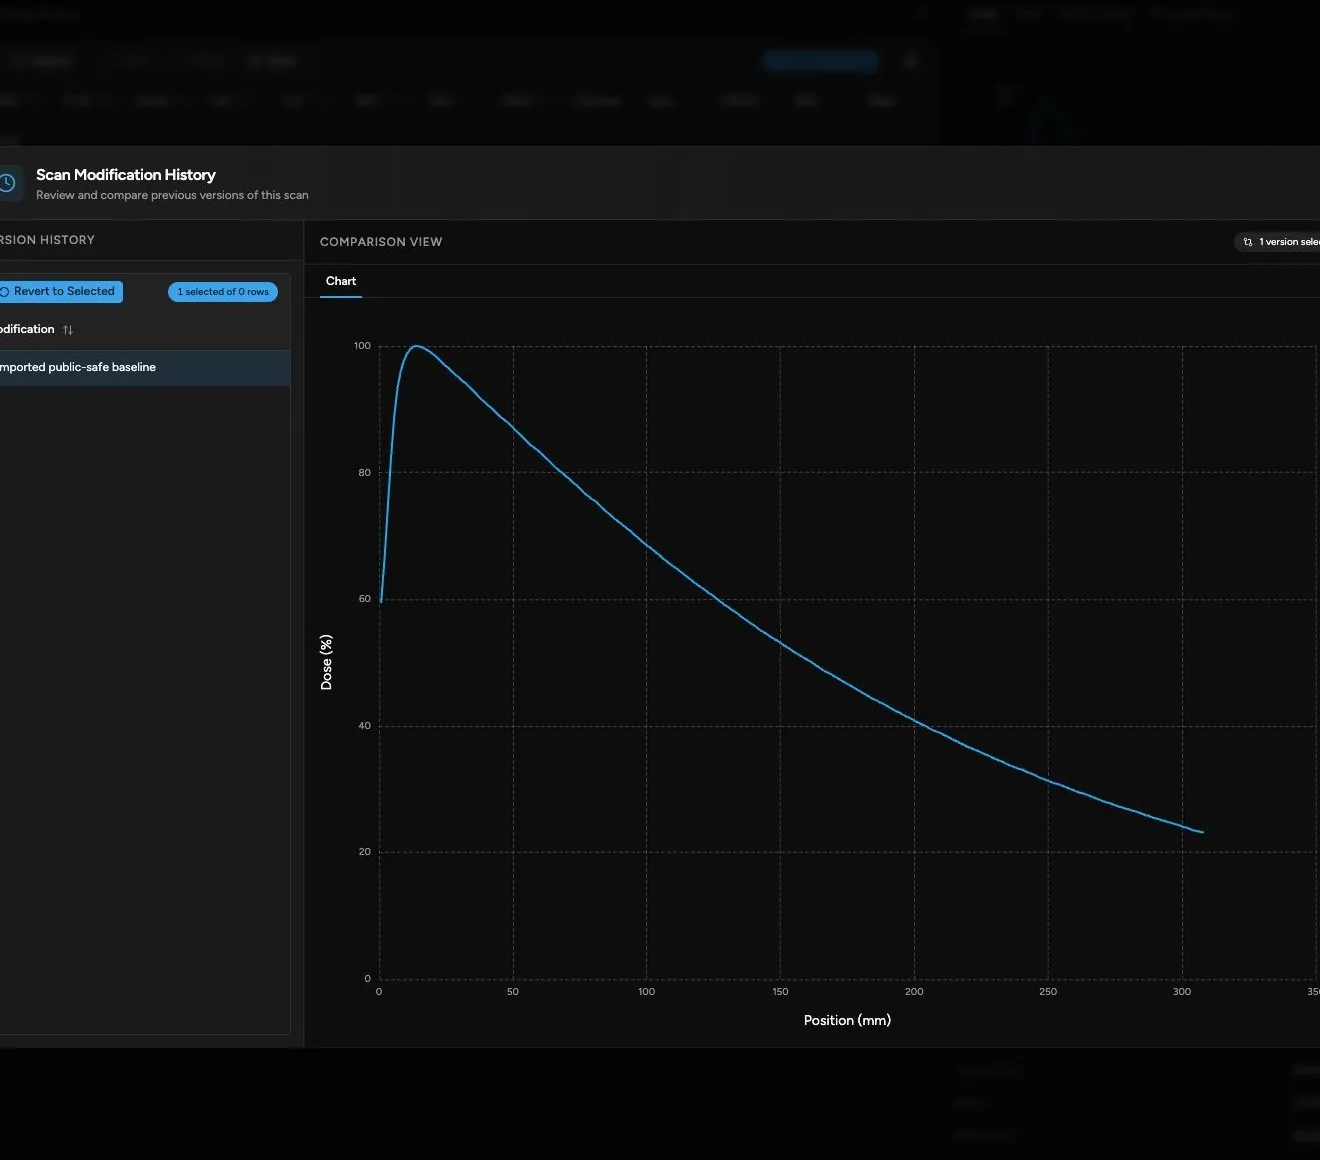
Section titled “Scan History”If History is available for your account, select one scan and open History from the scan table toolbar.
The history view shows:
- A list of prior scan modifications.
- A comparison view for selected versions.
- A Revert to Selected action for returning the scan to a previous version.
History visualizations follow the same general data shape as the selected scan:
- Curve scans compare with Chart.
- Large SCT data compares with Surface.
- Point-style data compares with Table.