
Comparison Table
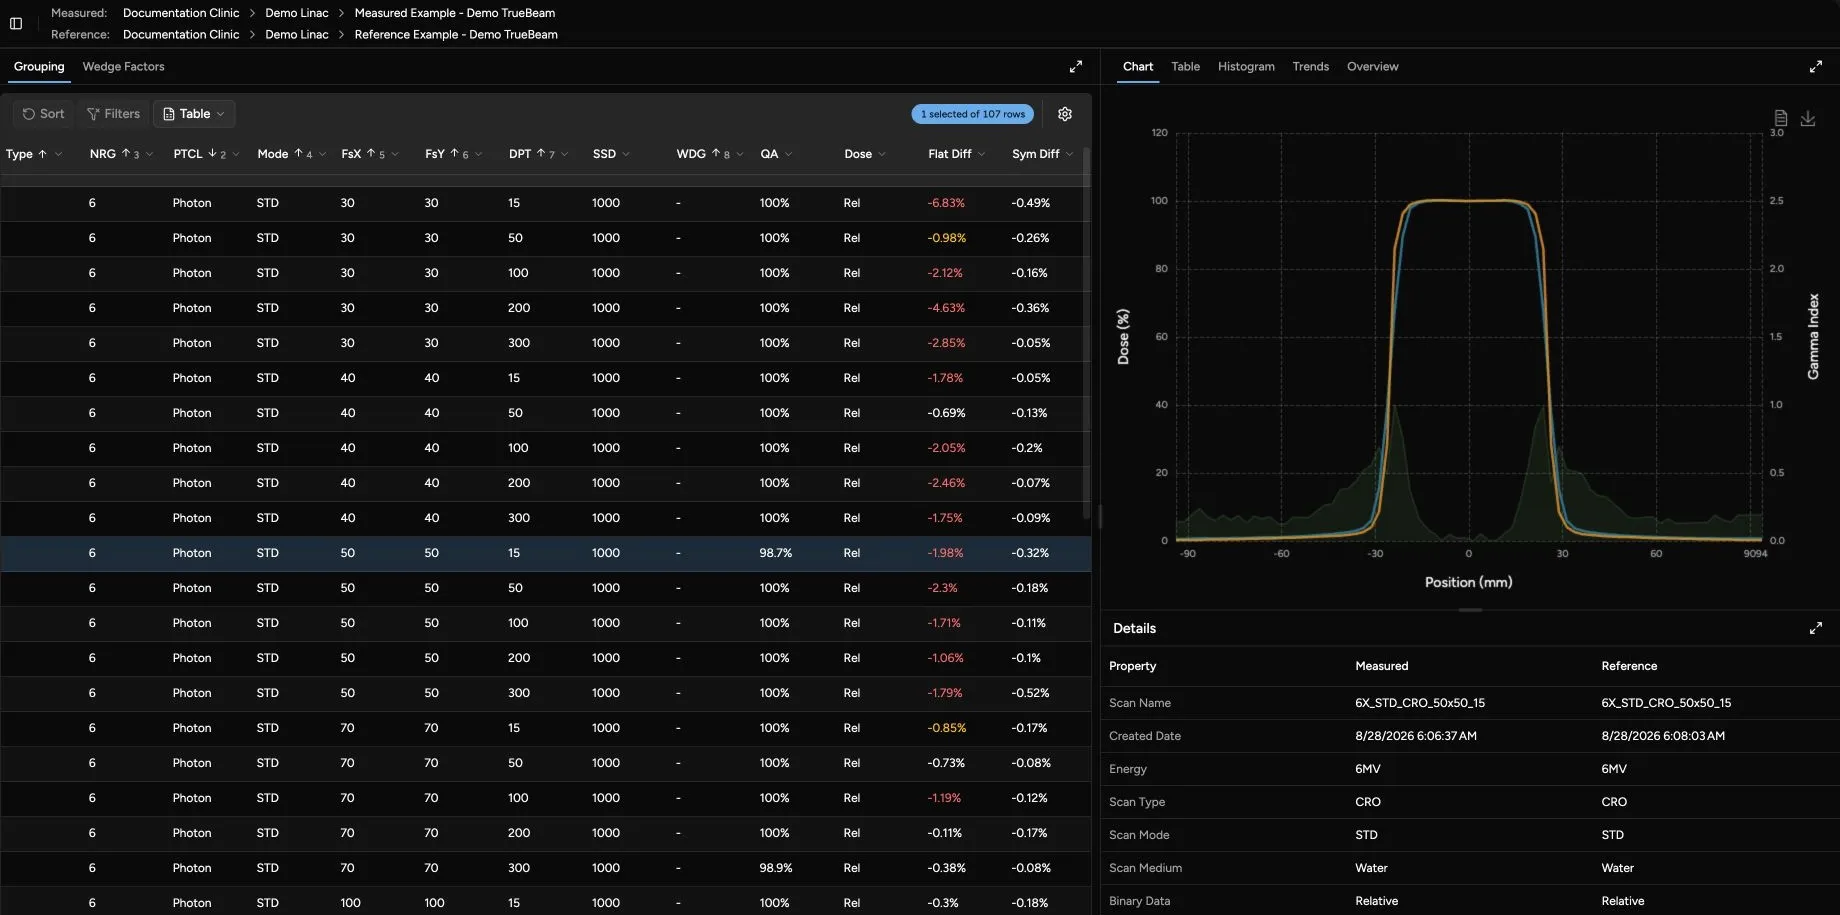
The Comparison panel is the main table for validation. Each row represents a measured scan and the reference scan Quadrant matched to it. Rows are grouped by scan type so you can review PDDs, profiles, scatter data, and other scan families separately.
Table Controls
Section titled “Table Controls”Use the toolbar above the table to manage the current view:
| Control | What It Does |
|---|---|
| Sort | Returns the table to Quadrant’s standard clinical sort order after you have sorted columns manually. |
| Filters | Removes column filters so hidden rows return to the table. |
| Table | Copies or downloads the currently visible comparison rows. |
| Group Settings | Changes how scan type groups open and close, which is useful when a data set has many scan types. |
The default sort uses scan type, particle, energy, mode, field size, depth, and wedge.
Columns
Section titled “Columns”| Column | Meaning |
|---|---|
| NRG | Nominal beam energy. Photon values are shown in MV and electron values in MeV when particle information is available. |
| PTCL | Radiation type used for matching and grouping, usually photon or electron. |
| Mode | Beam mode or modifier, such as standard, FFF, SRS, or another configured mode. A mode mismatch can prevent the expected reference match. |
| FsX | Field size in the X direction, in millimeters. This usually corresponds to the crossline jaw or equivalent field dimension. |
| FsY | Field size in the Y direction, in millimeters. This usually corresponds to the inline jaw or equivalent field dimension. |
| DPT | Measurement depth in water-equivalent millimeters. Quadrant can group shallow depths as DMax for filtering. |
| SSD | Source-to-surface distance used by the scan. This helps distinguish otherwise similar scans measured at different setup geometry. |
| Type | Scan family abbreviation, such as PDD, CRO, INP, TMR, or SCT. The group header gives the full scan type name when Quadrant knows it. See Scan Types for definitions. |
| WDG | Wedge identifier used for matching wedged fields. A blank value means the scan is open-field or has no wedge recorded. |
| QA | Main comparison result. For curves, this is the gamma pass rate. For point or scatter data, this is the available percent-difference style metric. Unavailable rows do not have a usable comparison result. |
| Dose | Whether the comparison used absolute dose values (Abs) or relative dose values (Rel). This is shown only when the row has a QA result. |
| Flat Diff | Difference between measured and reference flatness for supported profile scans. This is separate from the point-by-point gamma result. |
| Sym Diff | Difference between measured and reference symmetry for supported profile scans. This helps identify profile shape changes that may not be obvious from the QA column alone. |
Unavailable comparisons show an Unavailable marker in the QA column. This usually means Quadrant could not calculate a valid comparison for that measured/reference pair. Select the row and review the Details panel for the specific context before assuming the scan itself is bad.
Select Scans For Analysis
Section titled “Select Scans For Analysis”Select one comparison row to update the Analysis and Details panels for that scan. Single selection enables scan-specific views such as chart, surface, table, and PDD metrics when the selected scan supports them.
Select multiple rows when you want comparison-level analysis across a subset of scans. Multiple selection is most useful for the Histogram tab.
With no row selected, the analysis panel defaults to the overall Overview when comparison data is available.
Wedge Factors
Section titled “Wedge Factors”Use the Wedge Factors tab in the Comparison panel to compare measured and reference wedge factors.
| Column | Meaning |
|---|---|
| Wedge | Wedge label from the measured factor record. Rows are grouped so related wedge factors stay together. |
| Measured | Factor from the measured data set. |
| Reference | Factor from the reference data set. |
| Diff (%) | Percent difference between measured and reference, color-coded when the difference is larger. |
Wedge factor rows are grouped and sorted by wedge, energy, and field size. Wedge factor comparison is not available when either side is an aggregate.
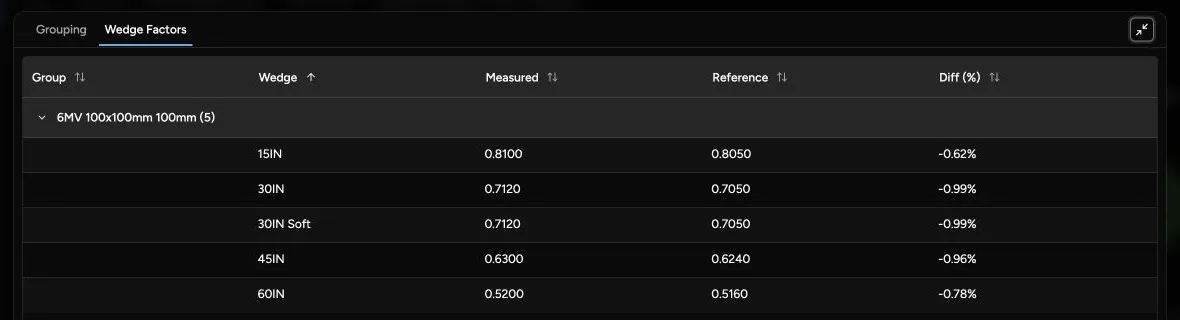
Table Export
Section titled “Table Export”The Table export in the comparison table exports the visible table columns from the current view. It follows the table’s current filtering and sorting.
Use this export for quick spreadsheet review of the comparison rows. Use Validation > Reports or Validation > Batch Export when you need formal report output.