
View a Data Set
Use Data > Scans to inspect the contents of a data set.
Page Layout
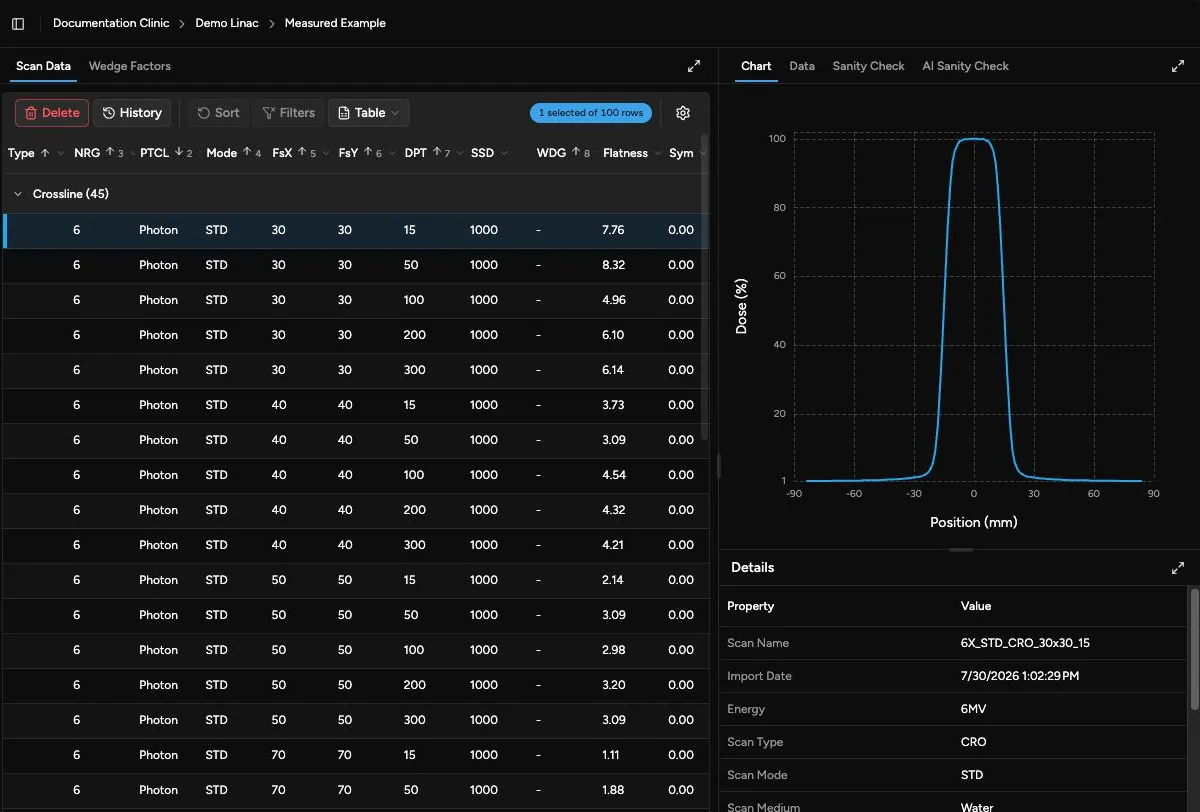
Section titled “Page Layout”The Scans page is organized around three review areas:
| Area | What It Shows |
|---|---|
| Data | The scan table and wedge factor table. |
| Visualization | Charts, surfaces, point tables, and sanity checks for selected scans. |
| Details | The property list or processing message for one selected scan. |
On smaller screens, these areas may stack or collapse differently, but the same information is available.
Select the Data Set
Section titled “Select the Data Set”- Open Data > Scans.
- If no data set is selected, the selector opens automatically.
- If a data set is already selected, click the breadcrumbs in the page header to reopen the selector.
- Select the institution.
- Select the linear accelerator.
- Select the data set.
Use the data set type/source control to narrow the list when many data sets are available. You can filter by Measured, TPS, Other, Commissioning, Annual, Monthly, or Misc.
For more detail on the data set selector, see Select a Data Set.

Scan Data Table
Section titled “Scan Data Table”The Scan Data tab lists the scans in the selected data set. Scans are grouped by scan type. The table includes measurement context such as energy, particle, mode, field size, depth, SSD, wedge, and calculated values such as flatness, symmetry, PDD10, R50, and DRef when available.
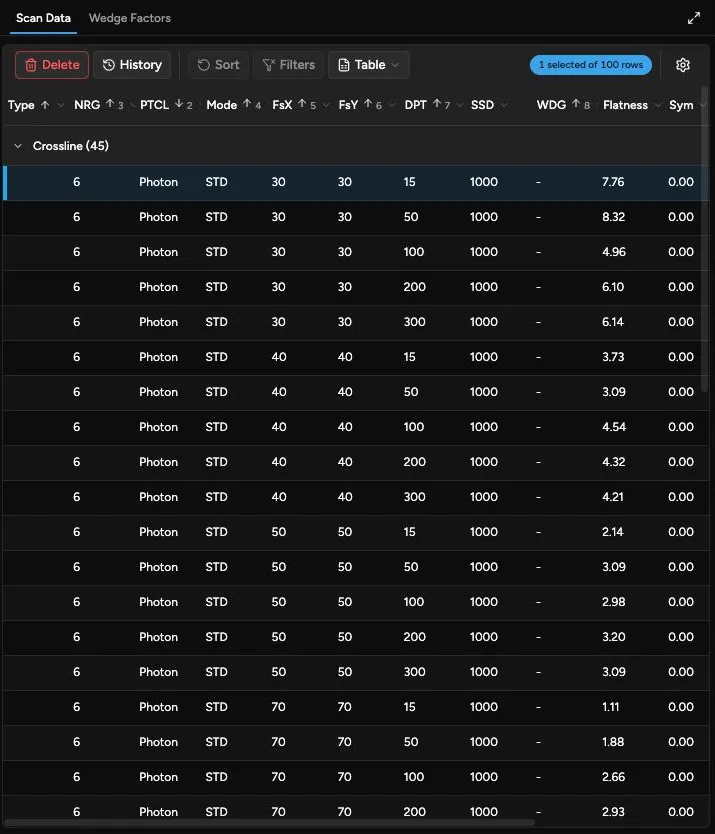
You can:
- Sort and filter table columns.
- Reset the default sort.
- Export the visible table.
- Select one or more rows.
- Delete selected scans when you have write access.
If Quadrant cannot process a scan, it marks the scan as Unavailable and shows the reason when available.
For column definitions, scan type abbreviations, table export, scan history, and visualization behavior, see Scan Data Table.
Wedge Factors
Section titled “Wedge Factors”Use the Wedge Factors tab to review wedge factor entries for the selected data set. You can sort, select, and delete wedge factors when you have permission.
To calculate and add factors from OPAB or OmniPro ASCII point-dose measurements, see Import Wedge Factors.
Visualization
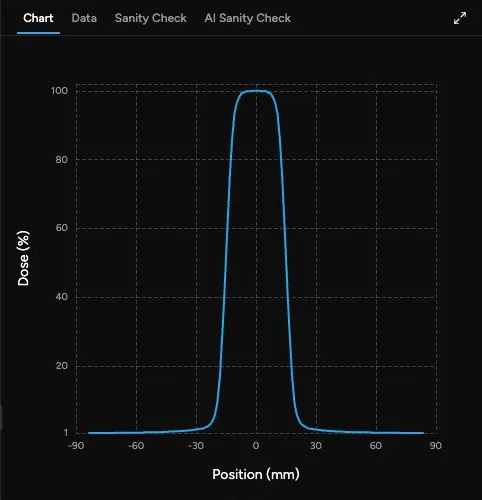
Section titled “Visualization”Select one or more scans to show charts, tables, point values, or checks in the visualization panel. The available tabs depend on the selected scan data:
- Chart for plotted scan curves.
- Surface for 3D surface data.
- Table for gridded data.
- Data for point values.
- Sanity Check for a basic consistency review of the selected data set.
When multiple scans are selected, Quadrant shows only the visualization tabs that can compare those scans.
Details
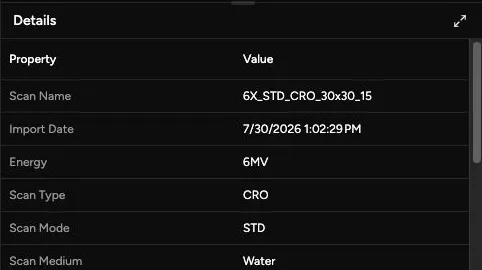
Section titled “Details”Select a single scan to view its details. If multiple scans are selected, choose one row when you need the detailed property list.
For unavailable scans, the details panel shows identifying information and the processing message instead of calculated results.
Changing Data Sets
Section titled “Changing Data Sets”Click the breadcrumbs in the page header to change the institution, linear accelerator, or data set.