Visualizations
Validation visualizations appear in the Analysis panel. Quadrant shows only the tabs that make sense for the current selection and data shape, so the tab list changes as you select different comparison rows.
Available Tabs
Section titled “Available Tabs”| Selection | Tabs You May See |
|---|---|
| No row selected | Overview, Histogram, Trends for the full comparison. |
| One curve-like scan | Chart for measured/reference overlay, Table for point values, PDD Metrics for percent depth dose (PDD) scans, plus summary tabs. |
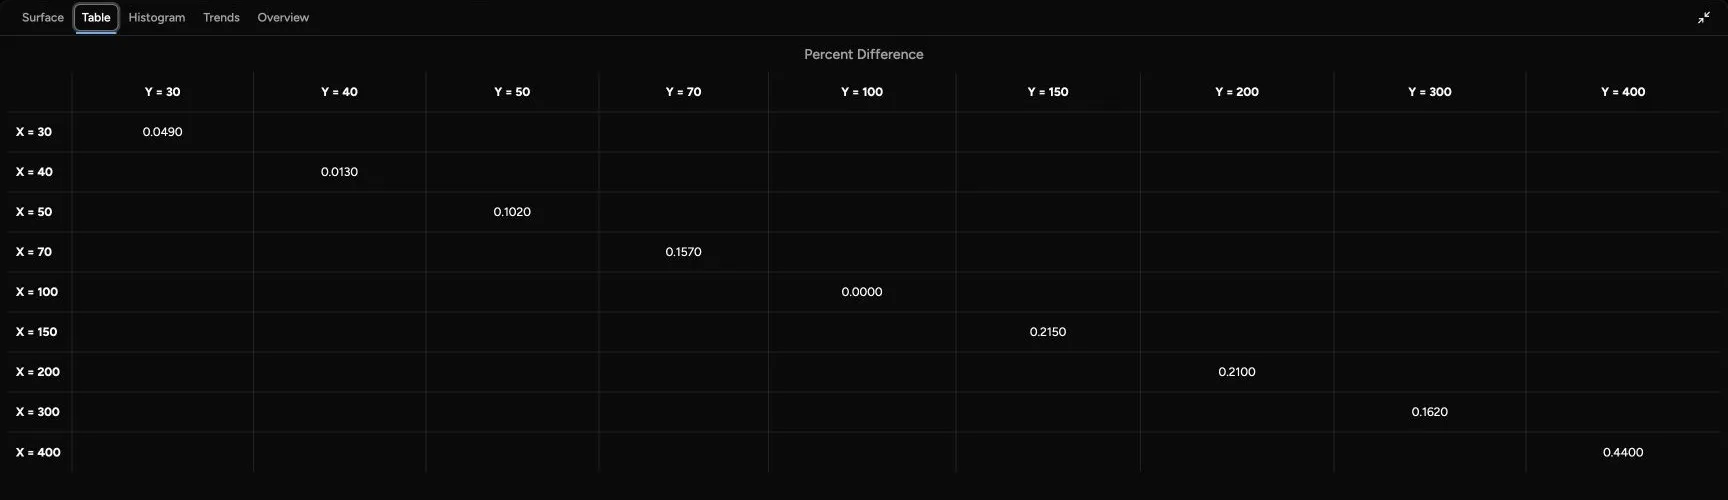
| One large output-factor (SCT) comparison | Surface for field-size behavior, Table for grid values, plus summary tabs. |
| One point-style comparison | Table for measured/reference values, plus summary tabs. |
| Multiple rows selected | Overview and Histogram can use the selected rows or the full comparison. Trends always uses the full comparison. |
The exact tab list depends on whether the selected comparison has curve data, large SCT data, point data, gamma data, and PDD-specific metrics.
When rows are selected, Overview and Histogram display a Selected scans only switch. It starts turned on. Turn it off to analyze the full comparison instead. Trends does not use this switch and always analyzes the full comparison.
For definitions of other scan-type abbreviations, see Scan Types.
Overview
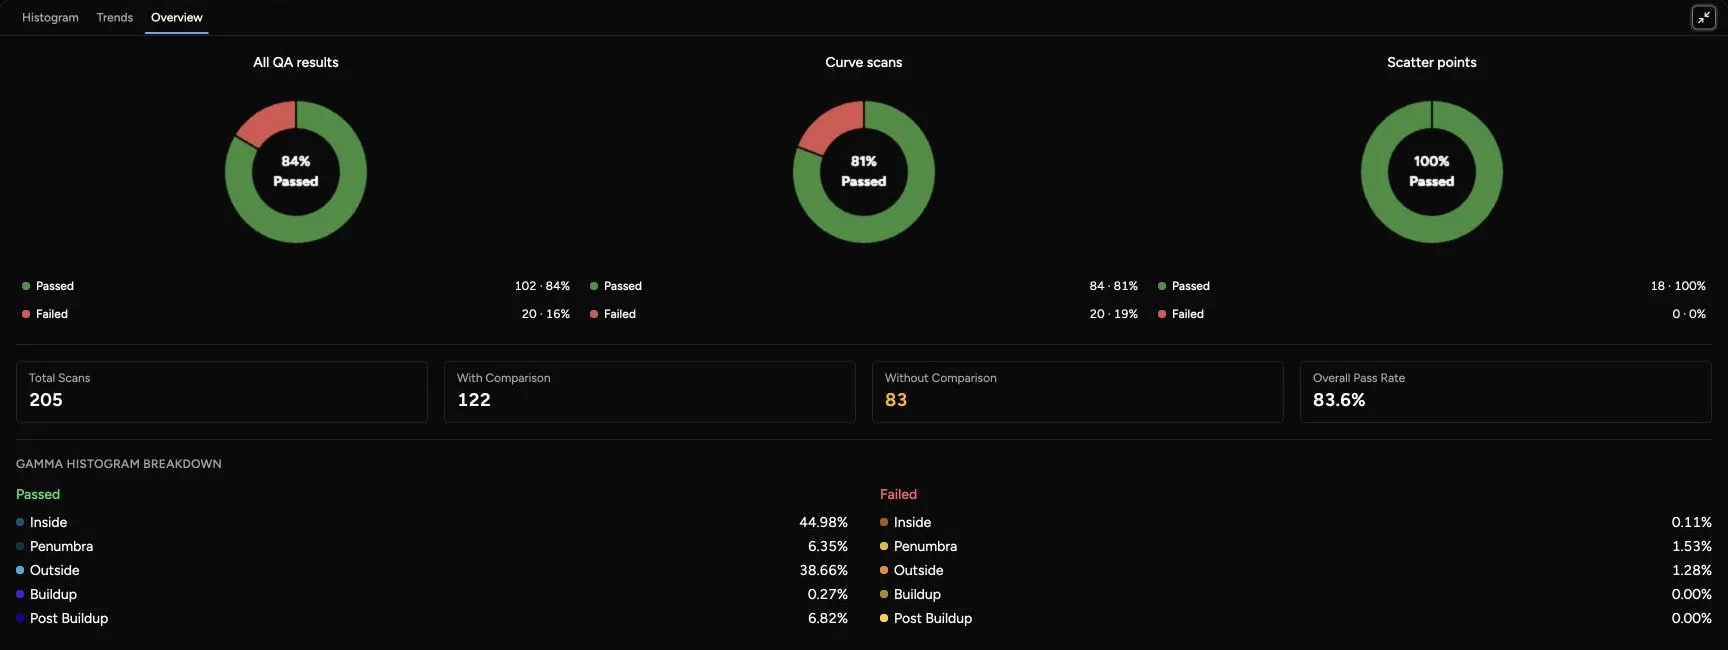
Section titled “Overview”The Overview tab summarizes the comparison as pass/fail statistics. It is a triage view: use it to decide whether the comparison is broadly clean or whether a scan family needs closer review. It shows pie charts for:
- All comparisons.
- Curves.
- Scatter.
It also shows total scans, scans with comparison data, scans without comparison data, and overall pass rate. The overview uses the applied QA metric settings, including maximum gamma failure and maximum percent difference. A scan without comparison data is not counted the same way as a failed comparison; it means Quadrant did not have usable matched comparison data for that row.
Use the overview to answer: “Is this comparison broadly acceptable, and where should I look first?”
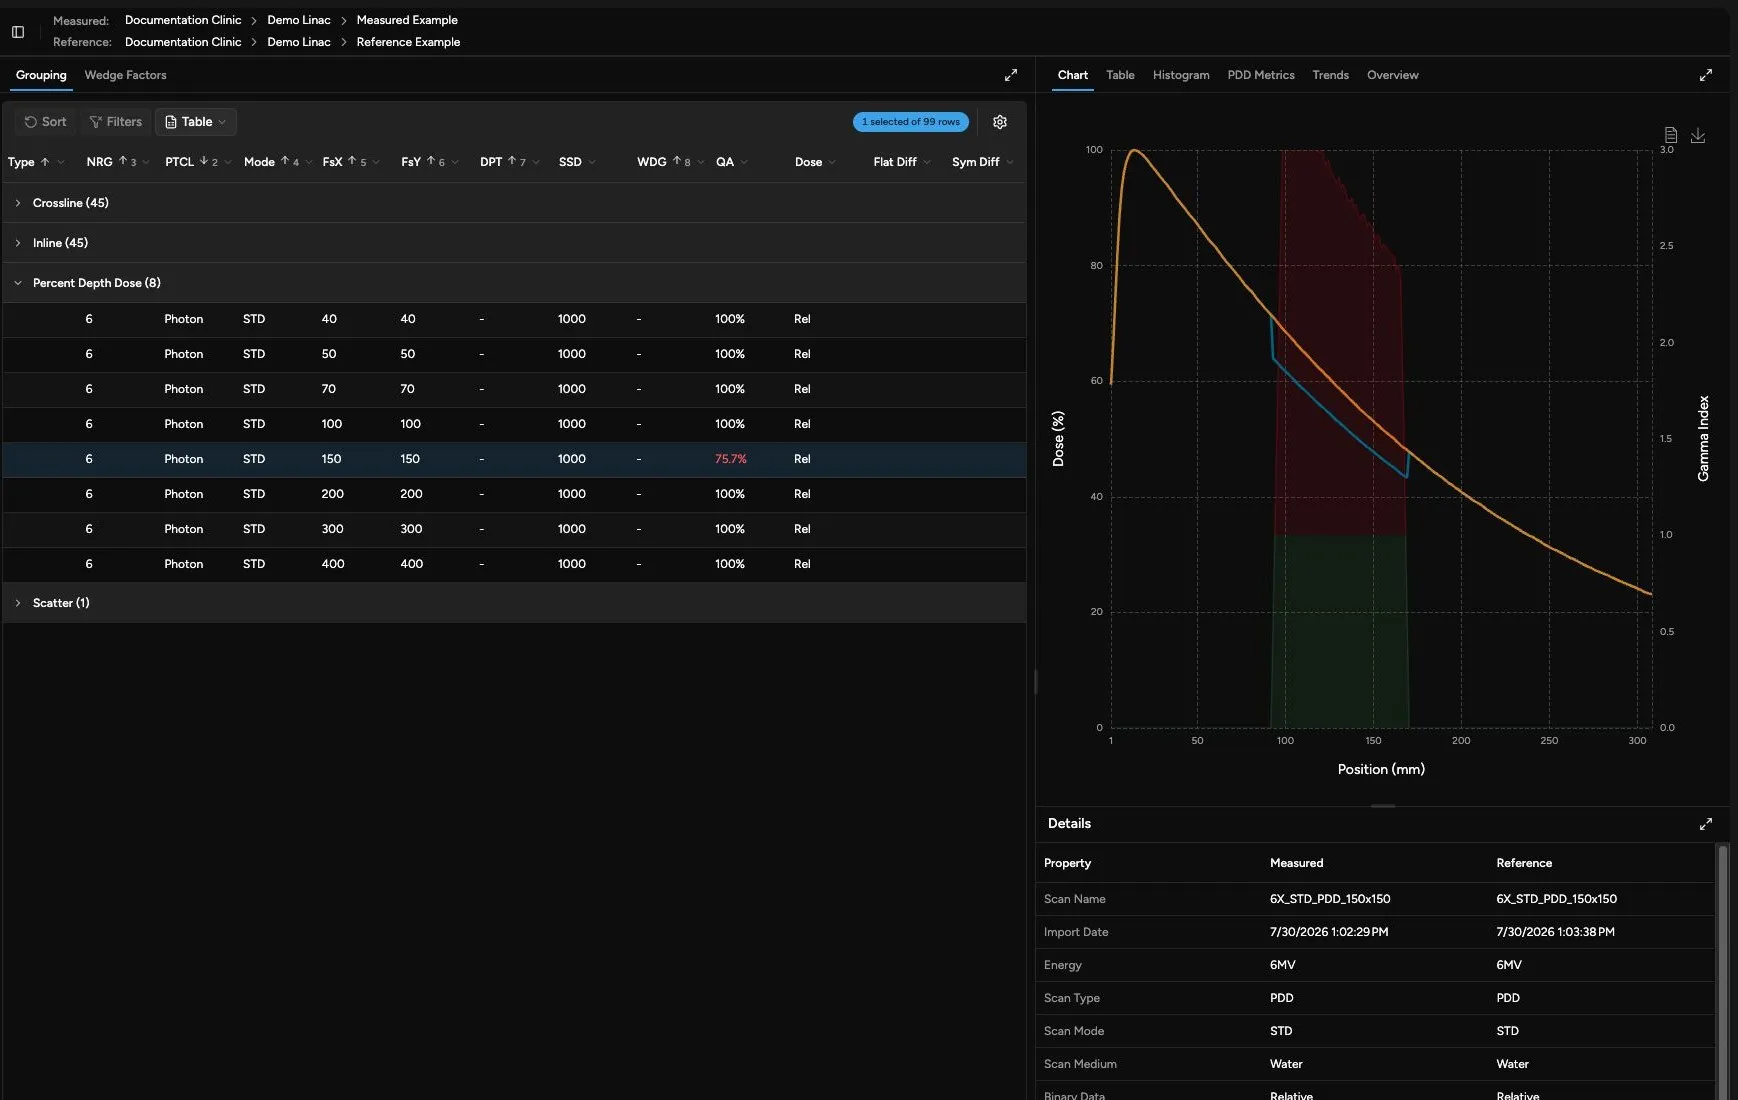
The Chart tab overlays measured and reference curve data.
| Visual Element | Meaning |
|---|---|
| Measured | The curve from the measured source. |
| Reference | The matched curve from the reference data. |
| Gamma Index | A secondary-axis curve when gamma data is available. Values above 1 indicate points failing the applied gamma criteria. |
| Percent Diff | A secondary-axis curve for point/scatter data displayed as a curve. It shows local measured-versus-reference difference rather than gamma. |
Use chart zoom and tooltips to inspect local regions where the measured and reference curves separate. For profile and depth-dose curves, gamma behavior is often more useful than the dose curves alone because it combines dose difference and distance-to-agreement.
Surface
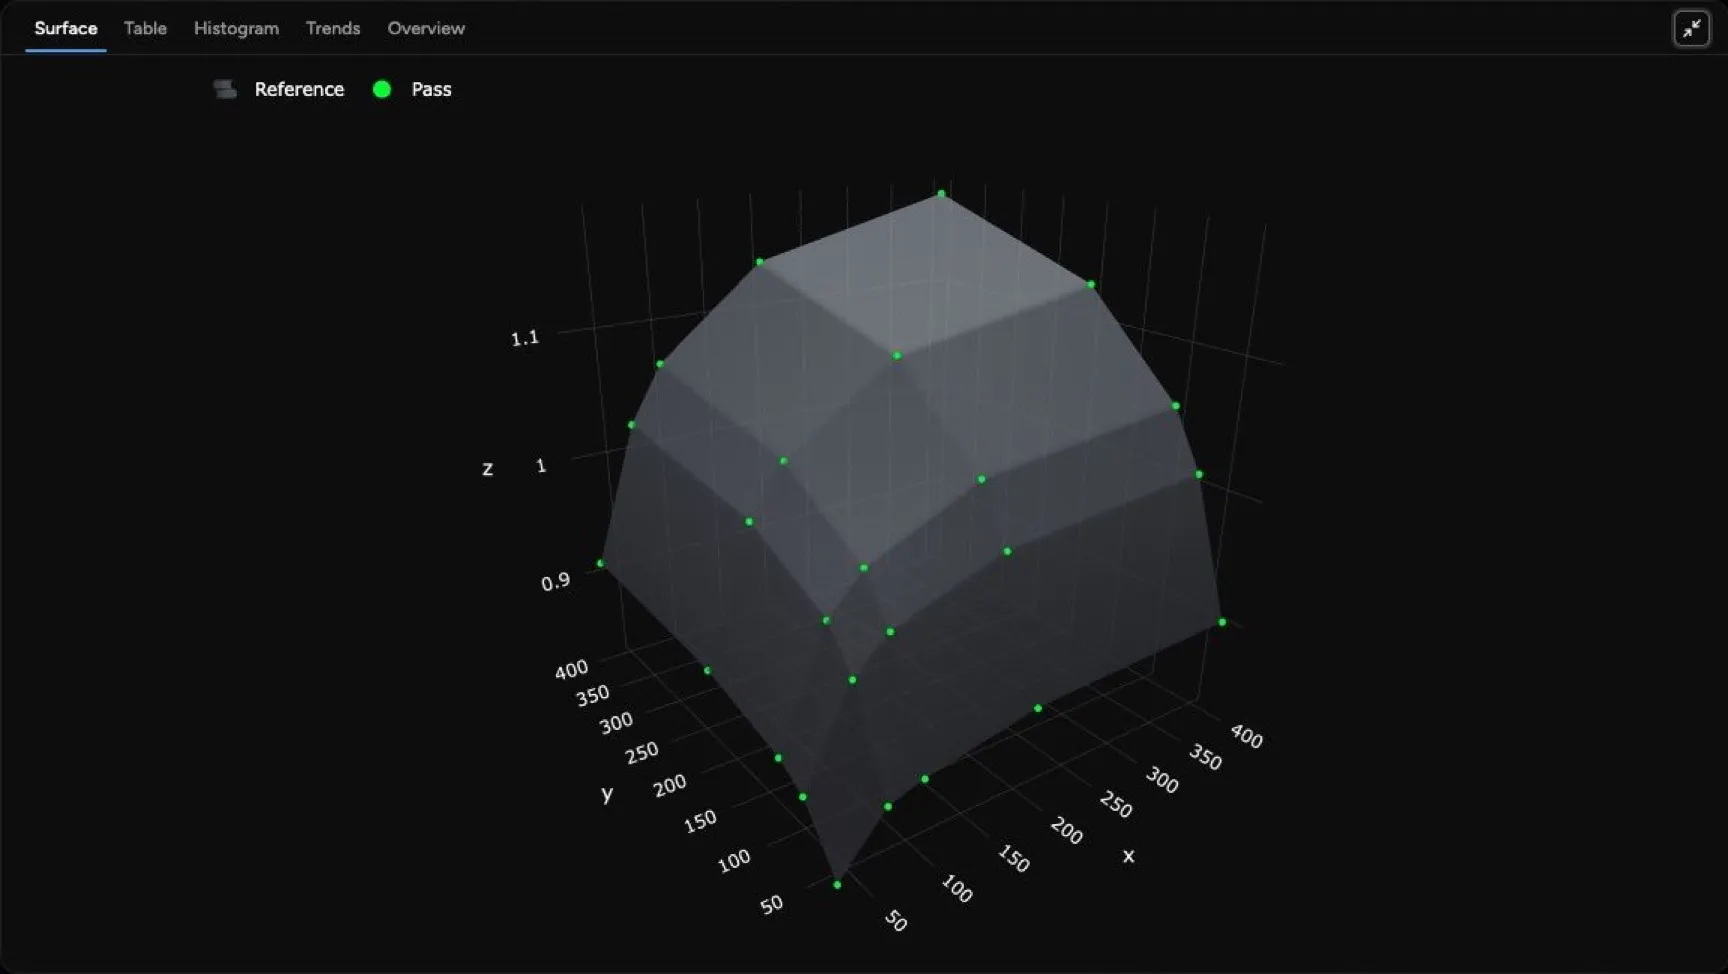
Section titled “Surface”The Surface tab is used for large SCT comparisons where the data is naturally arranged as a field-size surface. Use it to look for systematic field-size regions where measured and reference output factors diverge, rather than judging one field size at a time.
The Table tab shows point-by-point comparison values for one selected scan.
| Column | Meaning |
|---|---|
| Pos (mm) | Position along the curve or point sequence. |
| Meas | Measured dose at that position, in percent or cGy depending on the comparison. |
| Ref | Reference dose at that position, in the same unit as measured. |
| Diff (%) | Local percent difference between measured and reference. |
| Gamma | Gamma index for that point when Quadrant calculated gamma data. Values above 1 fail the applied gamma criteria. |
The table supports sorting, filtering, and table export. Use it when you need exact point values behind a chart. For SCT comparisons, the table uses X and Y field sizes as its row and column axes, and each cell shows the percent difference.
Histogram
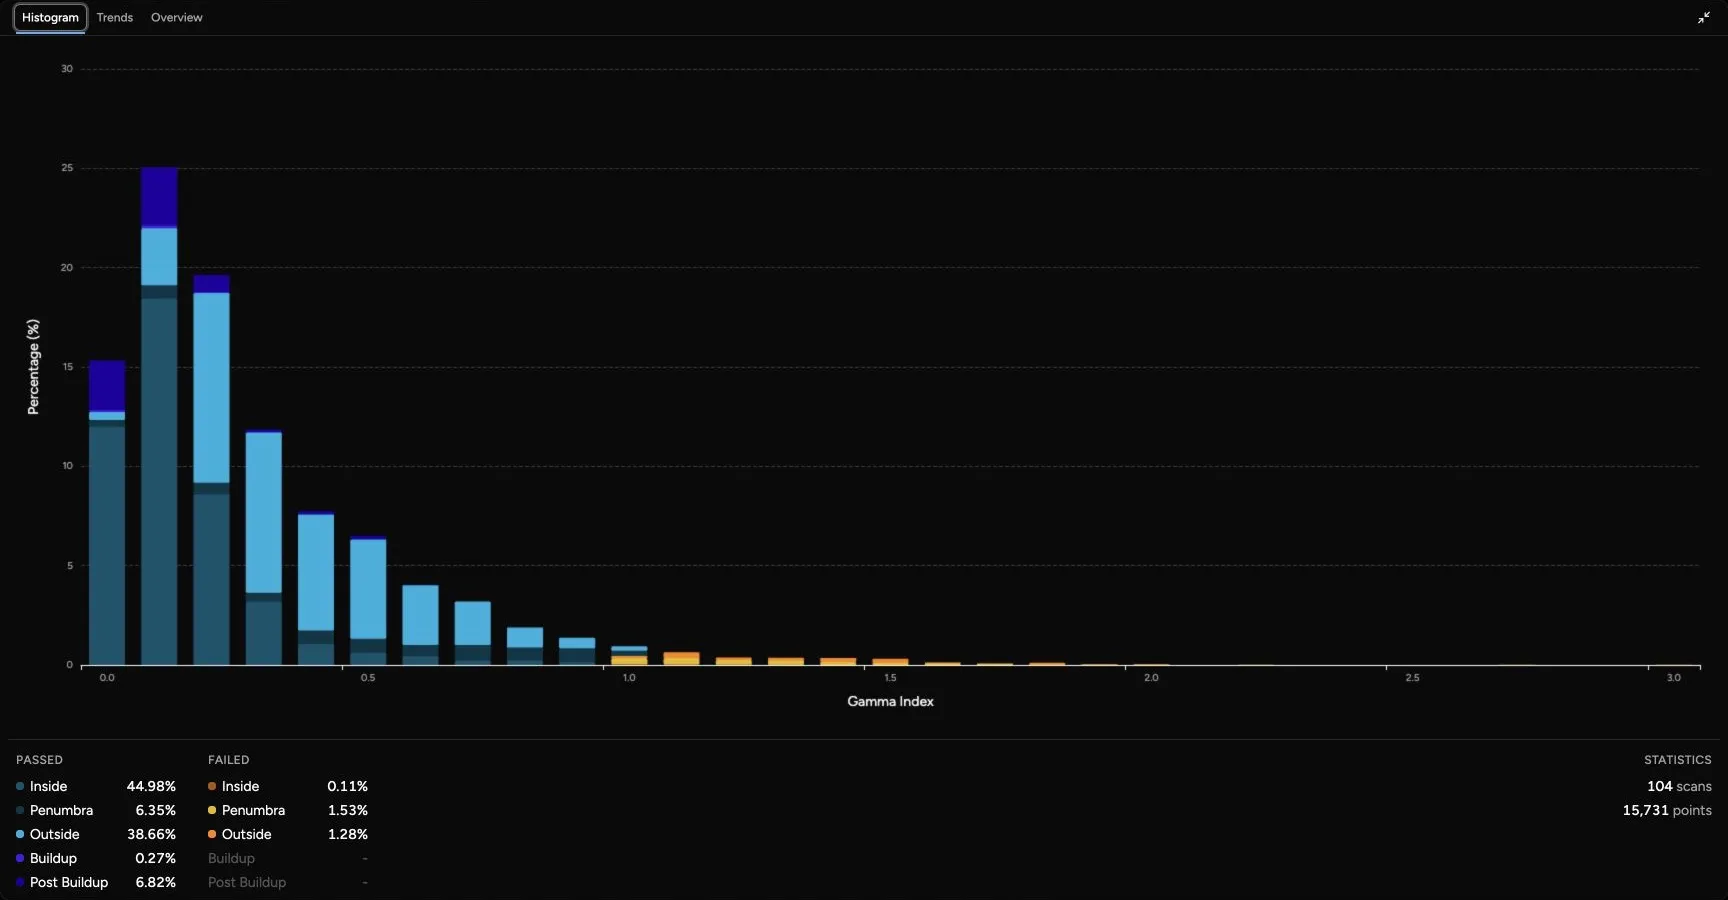
Section titled “Histogram”The Histogram tab shows the distribution of gamma index values. When rows are selected, Selected scans only starts turned on and limits the histogram to those rows. Turn it off to use the full comparison. When no rows are selected, the histogram uses the full comparison.
Histogram categories are grouped by pass/fail and by region. This helps separate, for example, failures in a profile penumbra from failures in the high-dose central region.
| Region | Used For |
|---|---|
| Inside | Profile points in the main field region. |
| Penumbra | Profile points in the field edge region, where small positioning differences can strongly affect dose difference. |
| Outside | Profile points outside the field region. |
| Buildup | PDD points before depth of maximum dose. |
| Post Buildup | PDD points beyond buildup, where depth-dose falloff is usually the focus. |
Use the histogram to distinguish a broad failure pattern from a small number of localized failing points.
PDD Metrics
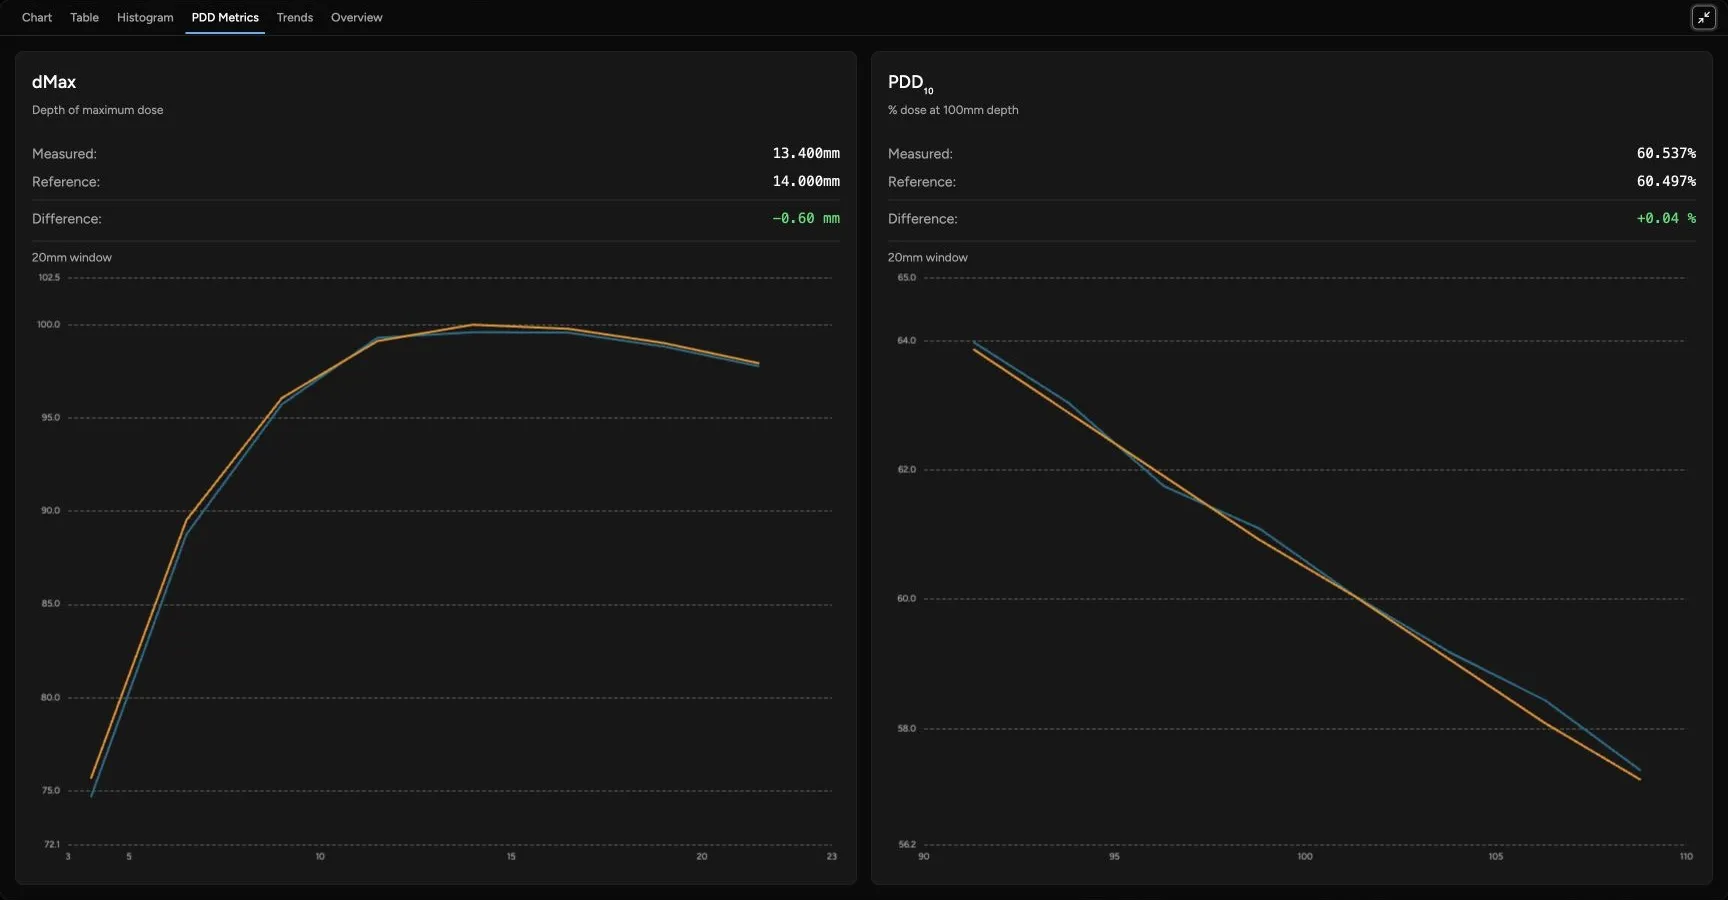
Section titled “PDD Metrics”The PDD Metrics tab appears for PDD selections when detailed PDD comparison data is available. Use it to review clinically familiar depth-dose metrics such as photon PDD10 and electron R50-related values without leaving the selected scan comparison.
Trends
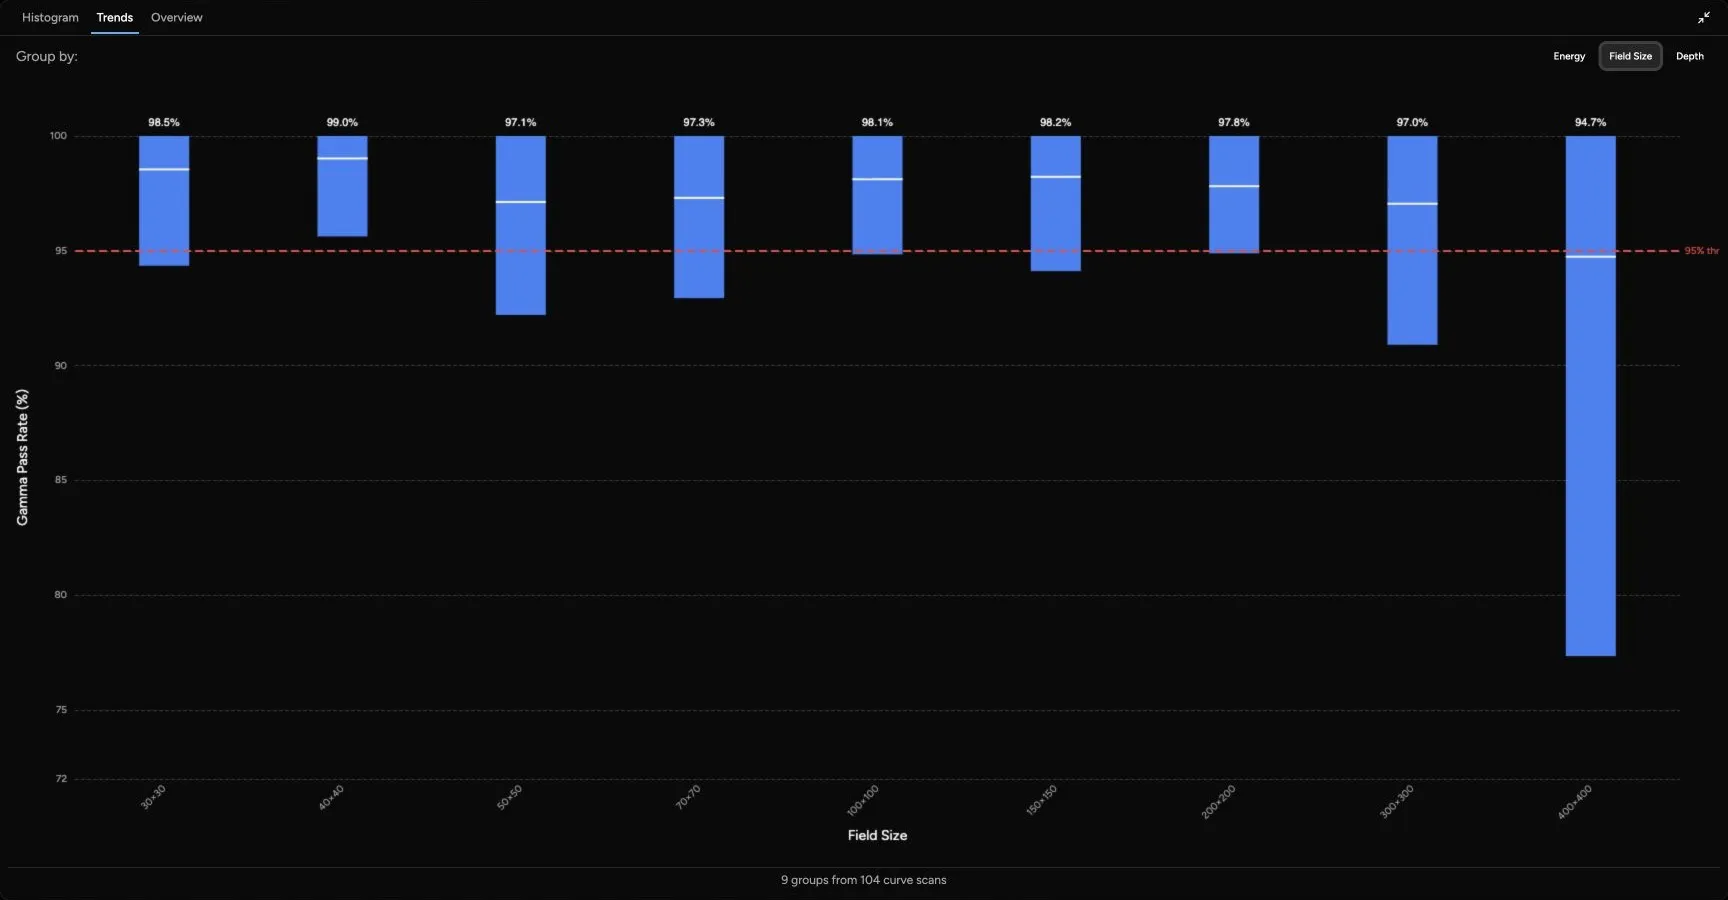
Section titled “Trends”The Trends tab always groups curve QA results from the full comparison, even when rows are selected elsewhere on the page. Use it to find systematic issues across the comparison. You can group by:
| Group By | Use It To Look For |
|---|---|
| Energy | Whether a photon or electron energy is driving the comparison result. |
| Field Size | Whether small, reference, or large fields behave differently. |
| Depth | Whether comparisons at similar depths behave differently. Depth grouping uses Quadrant’s Delta Depth setting, so scans do not need exactly identical depths to appear together. |
Each group shows the mean gamma pass rate and the range from the lowest to highest value in that group. The dashed threshold line is based on the applied maximum gamma failure setting. For example, a 5% maximum gamma failure corresponds to a 95% gamma pass-rate threshold.