
Validation Overview
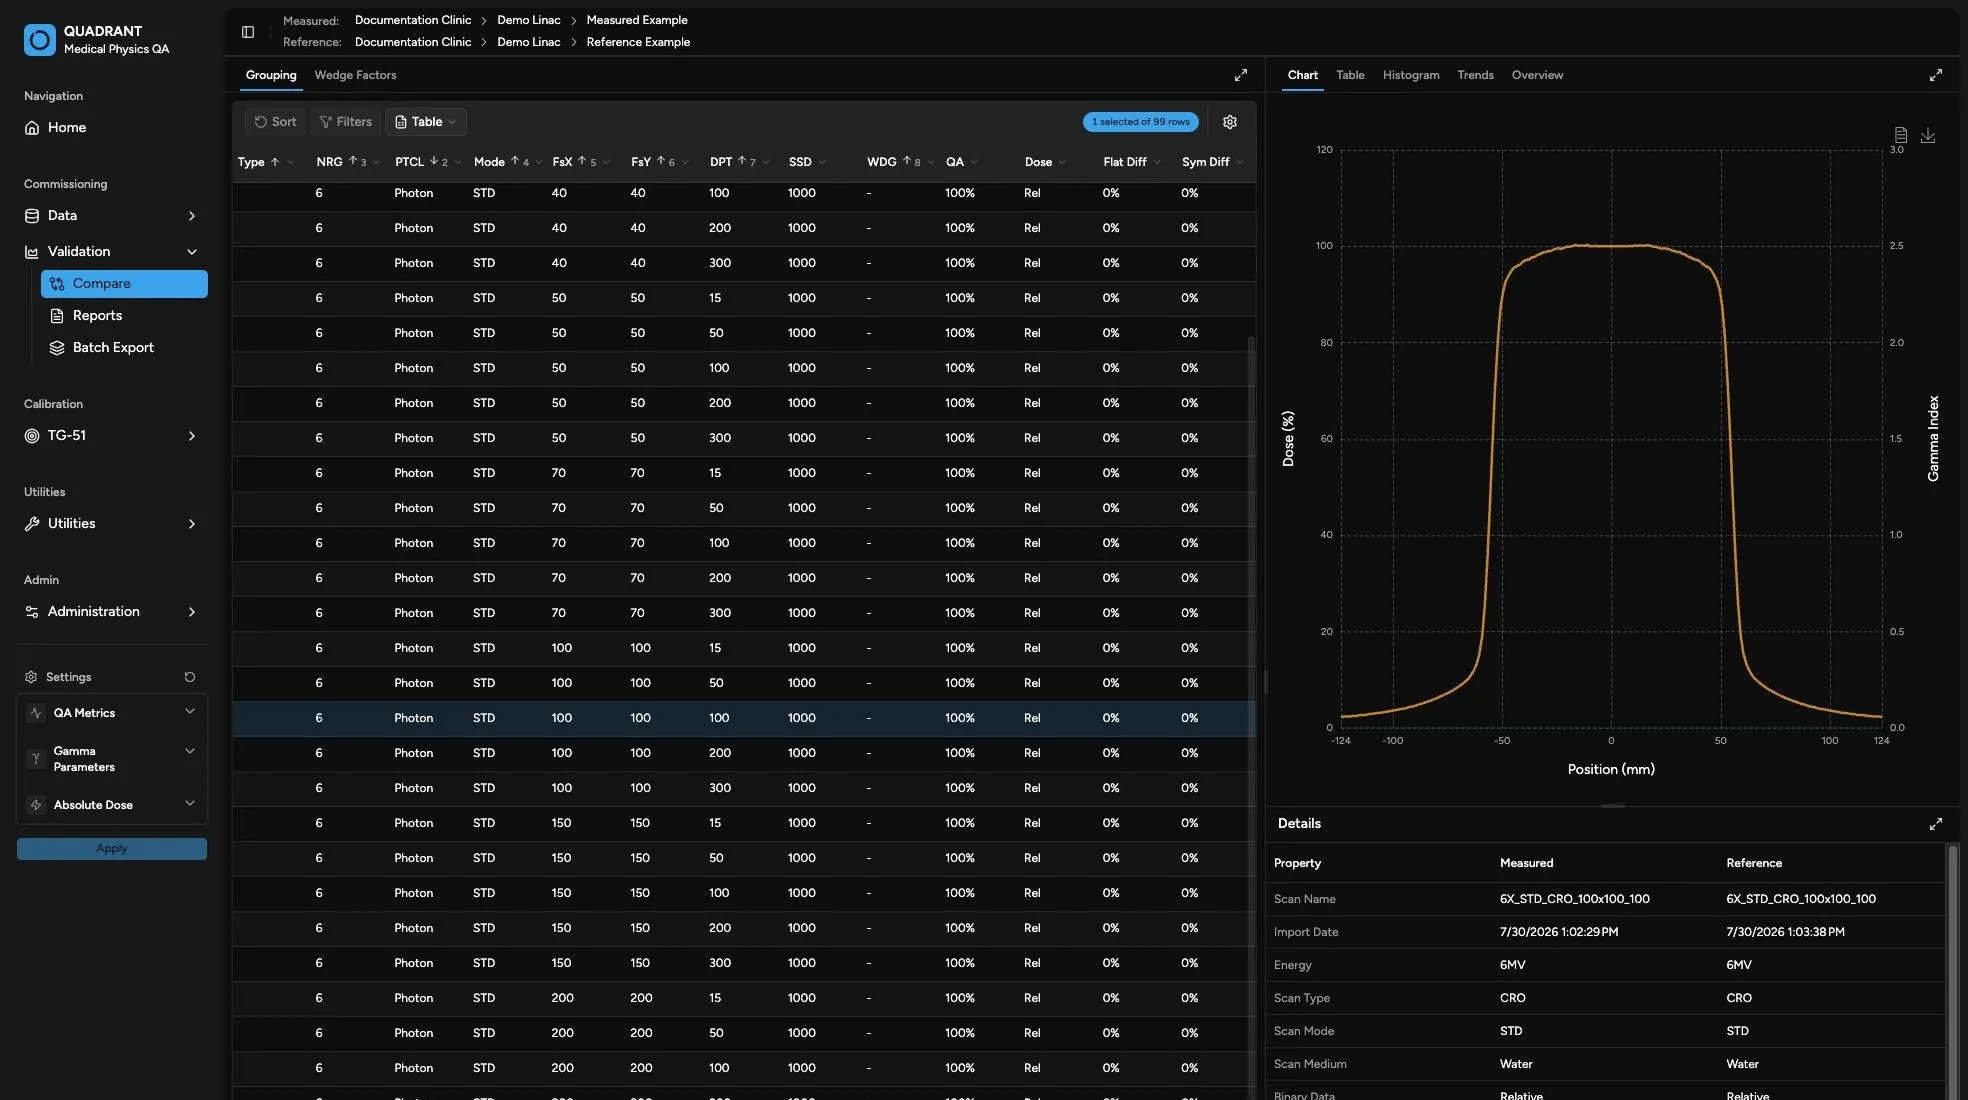
Use the Validation area to compare measured scan data against reference data. In Quadrant, a validation comparison is not just a visual overlay: Quadrant tries to match scans by beam characteristics, calculates comparison metrics, highlights scans that do not meet the applied criteria, and can turn the comparison into report output.
Depending on what is available for your account, a comparison source can be a data set or an aggregate. A data set is one named collection of scans. An aggregate is a compiled source that can represent a broader set rather than one uploaded data set. See Set Up a Comparison for the selection rules.
First-Time Path
Section titled “First-Time Path”If you are new to Validation, start here:
- Read Set Up a Comparison so you know how measured and reference selections work.
- Read Comparison Table so the table columns and selection behavior are clear.
- Read Visualizations before interpreting overview, chart, surface, histogram, PDD metrics, and trend views.
- Use Export Reports when you need one report for the current comparison.
- Use Batch Export when you need reports for several comparisons at once.
Validation Pages
Section titled “Validation Pages”Use the Validation menu in the application sidebar:
| Page | Use It When | What You Can Do |
|---|---|---|
| Compare | You want to compare one measured source to reference data. | Choose measured and reference data, adjust matching and pass/fail settings, review grouped scan results, select scans for analysis, compare wedge factors, and export table views. |
| Reports | You want a report for the current validation comparison. | Choose report type, title and options, included sections, scan filters, then generate and download the report. |
| Batch Export | You have access to batch export and need reports for multiple comparisons. | Queue up to five comparisons, review each without losing state, generate selected report types, and download the completed reports as one structured zip file. |
The main Validation page has three working areas:
| Area | What It Shows |
|---|---|
| Comparison | The matched scan list, grouped by scan type, plus a wedge factor comparison tab. This is where you choose which scan or scans to inspect. |
| Analysis | Visual summaries of the current comparison or selected scan, such as overview, chart, surface, table, histogram, PDD metrics, and trends. |
| Details | The measured/reference properties for the selected comparison row, useful when a row is unavailable or the match looks unexpected. |
Validation Settings
Section titled “Validation Settings”Validation settings appear in the sidebar. They affect the comparison results and the visual pass/fail indicators.
| Setting Group | Controls |
|---|---|
| QA Metrics | The tolerances Quadrant uses to color or flag results: allowed gamma failure percentage for curves, allowed percent difference for point/scatter data, and allowed flatness/symmetry differences for profiles. |
| Gamma Parameters | The gamma calculation criteria. Dose Criterion and DTA Criterion are the usual percent/mm gamma inputs. Delta Depth is Quadrant’s depth-matching tolerance in millimeters; it allows scans at similar but not identical depths to match. |
| Absolute Dose | Enables cGy-based comparison and defines the calibration conditions Quadrant should use: calibration depth, SSD or SAD mode, and photon/electron calibration field sizes. |
Default settings are 5.0% max gamma failure, 1.0% max percent difference, 1.0% max flatness difference, 1.0% max symmetry difference, 2% / 2 mm gamma, 4 mm delta depth, and absolute dose disabled.
Common Validation Exports
Section titled “Common Validation Exports”Quadrant has several export paths in Validation:
| Export | Where It Is | Use It For |
|---|---|---|
| Comparison table export | Validation, in the comparison table toolbar | A quick spreadsheet-style copy of the rows you are currently viewing after filters and sorting. |
| Point comparison table export | Analysis > Table, for one selected scan | The measured/reference point values behind one scan-level chart. |
| Report export | Validation > Reports | A formal PDF or zip report for the current comparison. |
| Batch export | Validation > Batch Export | Reports for several comparisons, downloaded together as one structured zip. |
What To Confirm Before Reporting
Section titled “What To Confirm Before Reporting”- Confirm the measured and reference selections in the header.
- Confirm validation settings in the sidebar.
- Review the Overview and Trends tabs for broad problems.
- Select any failing or unexpected scan rows and review the scan-level analysis tabs.
- Generate a report only after the comparison and filters match the intended review.