
Export Reports
Use Validation > Reports to generate report output for the current validation comparison. The Reports page inherits the measured data, reference data, QA Metrics, gamma parameters, and absolute dose settings from the Validation page, so confirm those on the main Validation page before starting the wizard. The inherited QA Metrics include the maximum allowed gamma failure percentage and maximum allowed percent difference.
Generate A Report
Section titled “Generate A Report”- Open Validation and confirm the measured/reference comparison.
- Apply any needed validation settings.
- Open Validation > Reports.
- Choose the report type.
- Enter the report title and report options.
- Choose report content when the selected report type supports content selection.
- Choose scan filters.
- Click Generate Report.
When generation completes, Quadrant downloads the report automatically.
Report Types
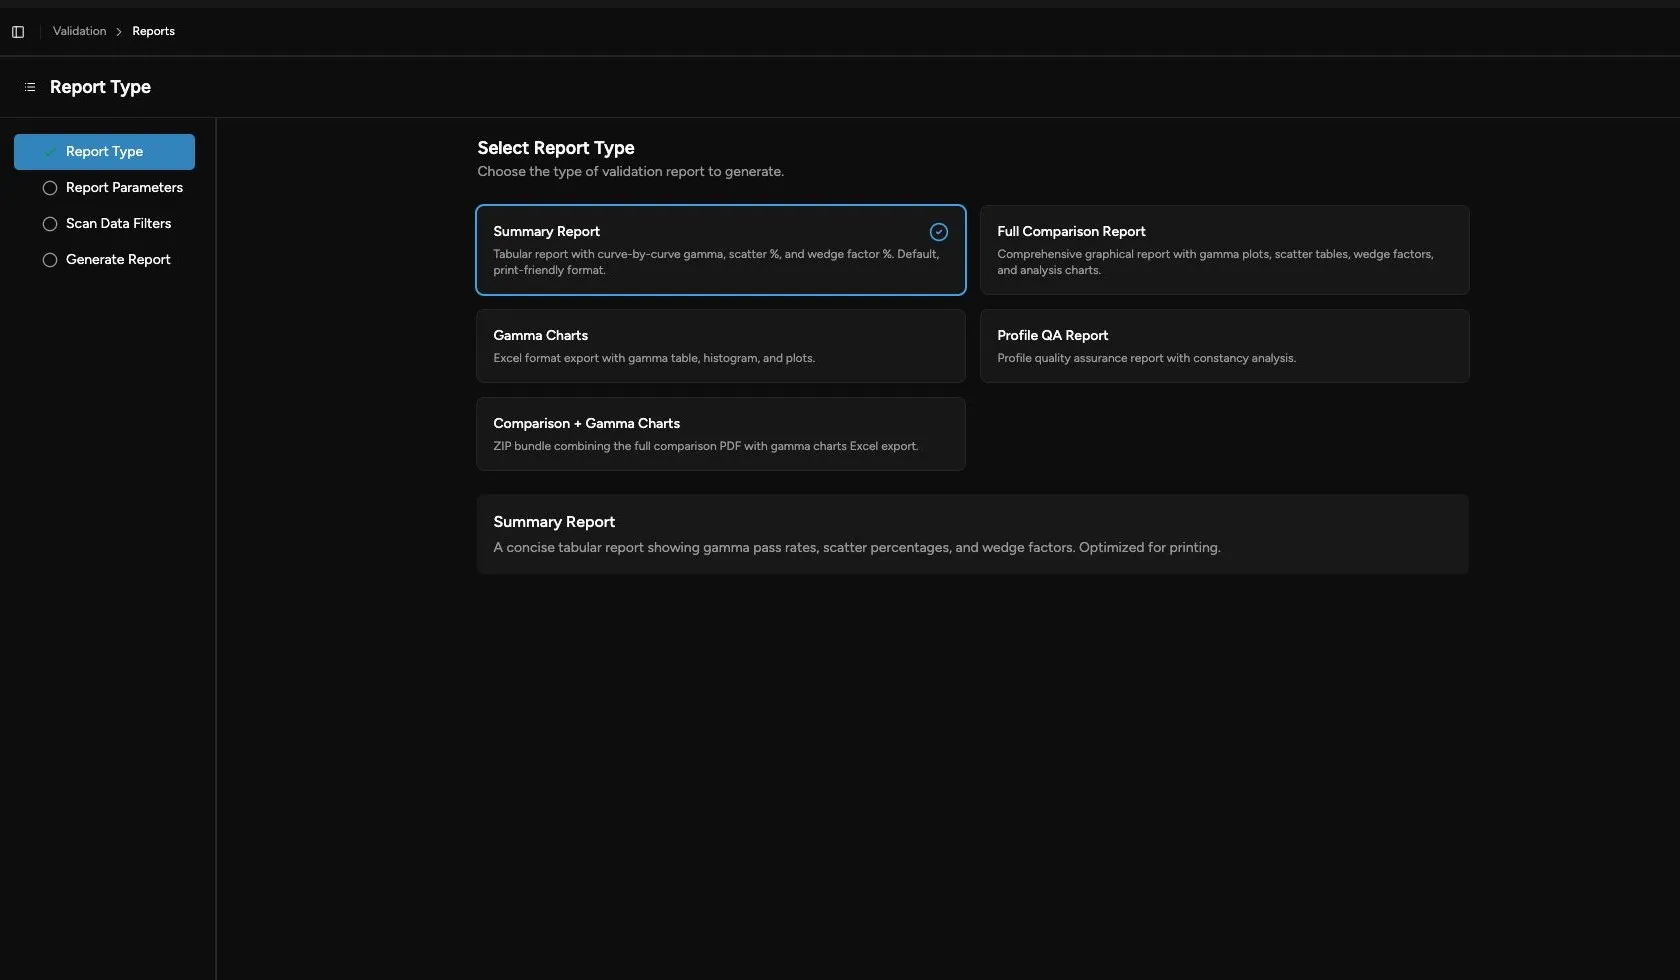
Section titled “Report Types”The report wizard shows only the report types available for your account. If a report type listed below does not appear, it is not available for your account.
| Report Type | Output | Availability | Use It For |
|---|---|---|---|
| Summary Report | Available for all accounts | A concise, print-friendly table report for documenting the comparison result without all supporting plots. | |
| Full Comparison Report | Available for all accounts | A graphical report for deeper review, including comparison plots and selected analysis sections. | |
| Gamma Charts | ZIP | Available for some accounts | Excel-based gamma tables, histogram, and plots for users who need the gamma data in workbook form. |
| Profile QA Report | Available for some accounts | Profile-focused QA output for constancy-style review. | |
| Comparison + Gamma Charts | ZIP | Available for some accounts | A combined package with the full comparison PDF and gamma chart workbook output. |
Report Parameters
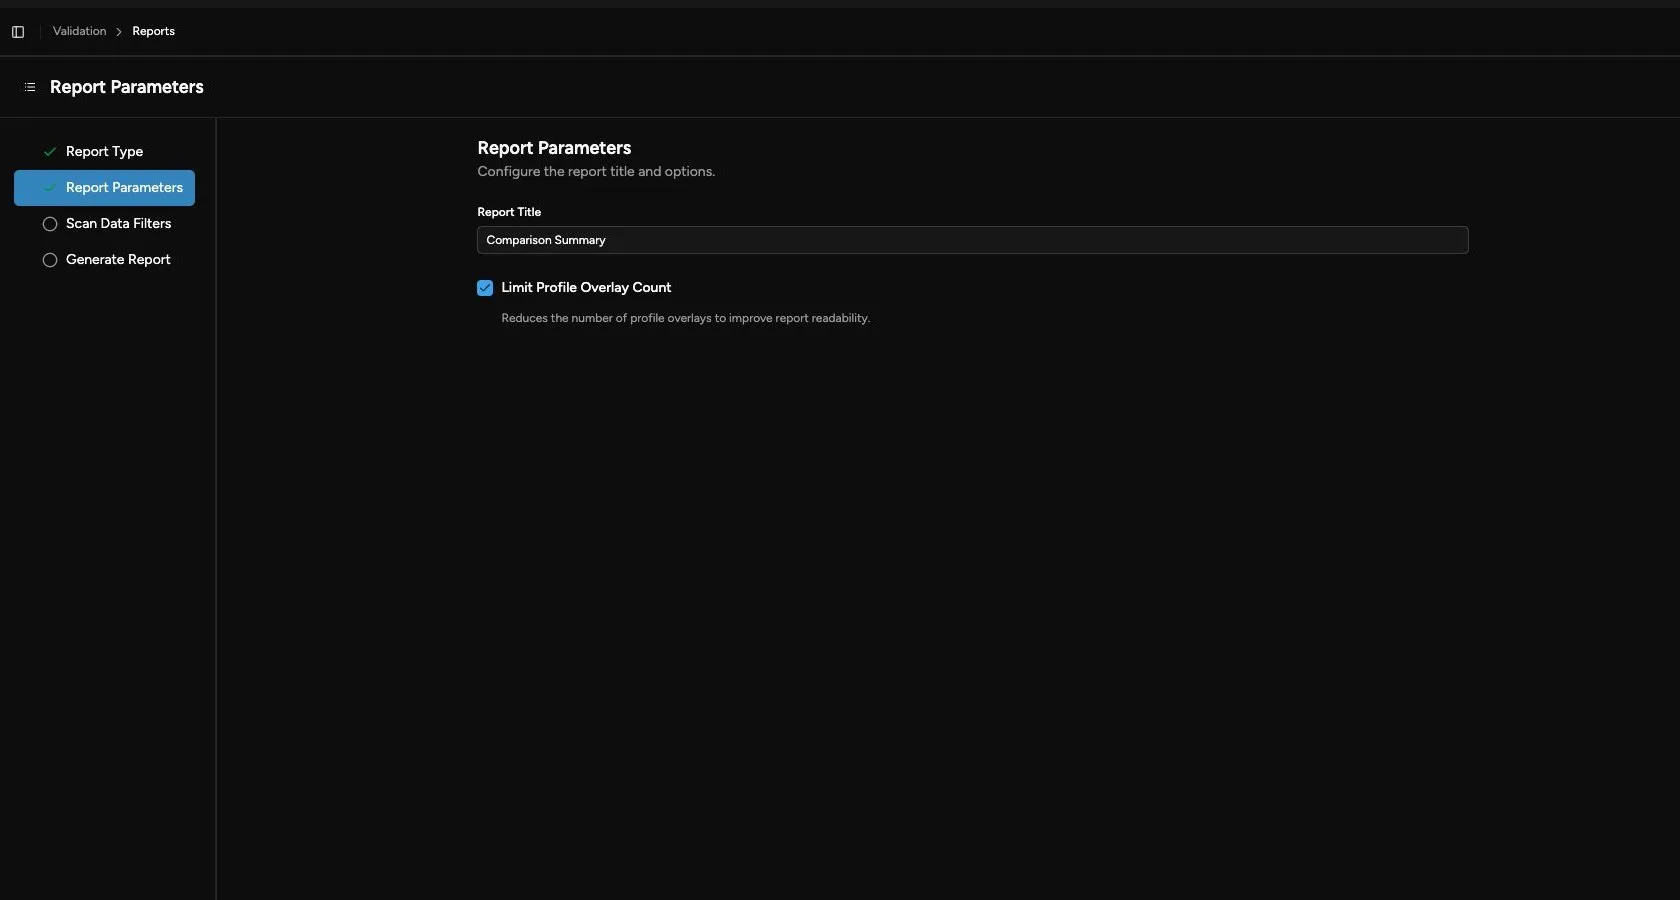
Section titled “Report Parameters”Depending on the selected report type and data, the wizard may ask for:
| Option | Meaning |
|---|---|
| Report Title | The title printed in the report. Use a title that names the machine, measured data, and reference when the default is not specific enough. |
| Reference Cone | Electron cone used as the reference for PDD10/R50-related report calculations when electron cone options are available. |
| Limit Profile Overlay Count | Reduces dense profile overlay pages so the report remains readable. Use this when many profile scans are included. |
| Use Relative Dose | Generates the report using relative dose even if absolute dose is enabled in Validation. This appears only when absolute dose is enabled. |
Report Contents
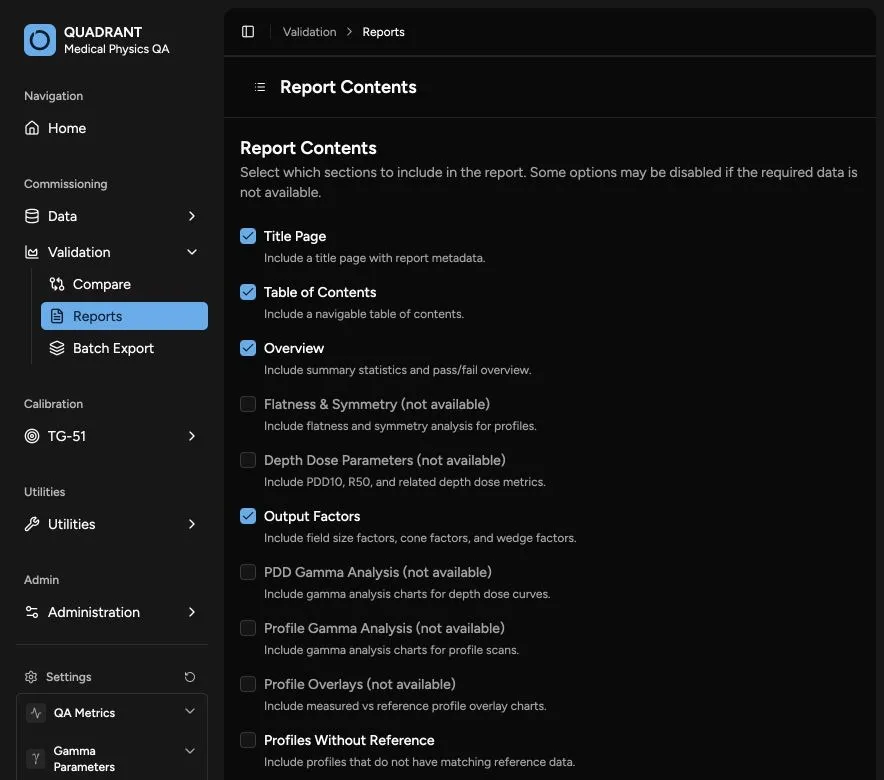
Section titled “Report Contents”For full comparison reports, choose which sections to include:
| Section | What It Adds |
|---|---|
| Title Page | Report metadata and title. |
| Table of Contents | Navigable report contents. |
| Overview | Summary statistics that show the overall state of the comparison. |
| Flatness & Symmetry | Profile shape metrics, useful when profile QA is part of the review. |
| Depth Dose Parameters | PDD10, R50, and related depth-dose metrics for PDD-focused review. |
| Output Factors | Field size factors, cone factors, and wedge factors. |
| PDD Gamma Analysis | Gamma analysis pages for depth-dose curves. |
| Profile Gamma Analysis | Gamma analysis pages for inline, crossline, and diagonal profiles. |
| Profile Overlays | Measured and reference profile plots, useful for visually confirming shape differences. |
| Profiles Without Reference | Profiles that did not have matching reference data, included so missing matches are visible in the report. |
Some content options are disabled when the selected comparison does not contain the required data.
Scan Filters
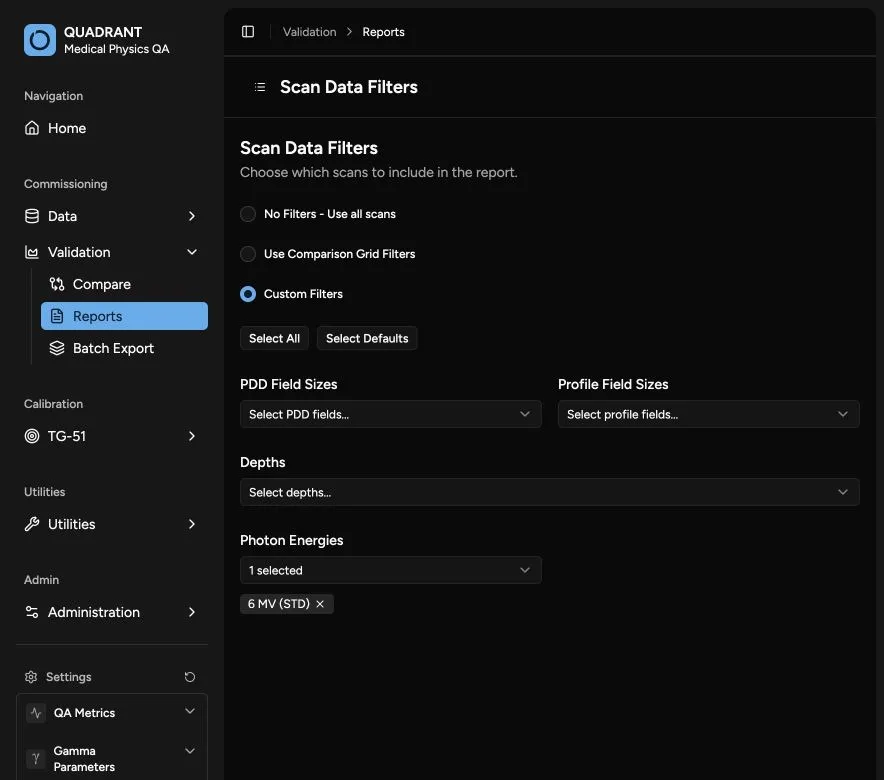
Section titled “Scan Filters”The report wizard supports three filter modes:
| Filter Mode | Meaning |
|---|---|
| No Filters - Use all scans | Includes every comparison row available to the report. |
| Use Comparison Grid Filters | Uses the filters currently applied on the Validation comparison table. Choose this when the table already shows exactly what you want reported. |
| Custom Filters | Lets you build report-specific inclusion rules by PDD field size, profile field size, depth, photon energy, and electron energy. |
For Gamma Charts, Separate by Energy controls whether the export is split by energy group.